
What do scanning dark skies for unexplained lights and scratching lottery tickets have in common? More than you’d think. A new study reveals that Canadian provinces, like British Columbia, where residents report the most UFO sightings, also show significantly higher lottery spending per capita, and the correlation is stronger than anyone expected.
The study by a trusted online gaming comparison platform, CasinosHunter, analyzed UFO sighting data from the National UFO Reporting Center alongside 2024 lottery sales figures from Statista across all Canadian provinces and territories. By calculating sightings per 100,000 residents and lottery sales per capita, researchers discovered a surprising connection between unexplained aerial phenomena and games of chance that challenges conventional wisdom about risk, hope, and the human psychology of believing in long odds.
British Columbia claims seventh place with a correlation score of 31/100. This Pacific province, with a population of 5,646,467, records 23 UFO sightings per 100,000 residents (UFO Sighting Score: 14/50) while maintaining $257.23 in per-capita lottery spending (Lottery Sales Score: 17/50) from $1.45 billion in total sales.
Looking at the study results, a spokesperson from CasinosHunter commented:
“This correlation reveals something profound about human psychology and the communities where hope, mystery, and possibility intersect. When we see provinces like British Columbia ranking highest in both UFO sightings and lottery participation, we’re not witnessing coincidence; we’re observing how communities with vast, unpopulated landscapes, extended darkness, and limited entertainment infrastructure develop unique relationships with both the unexplained and games of chance.”
Table for Extended Results
| Top 10 Canadian Provinces With the Highest UFO Sighting and Lottery Sales Correlation | ||||
| Canadian Province | UFO Sighting Score | Lottery Sales Score | Correlation Score (100) | Rank |
| Northwest Territories & Nunavut | 43 | 27 | 70 | 1 |
| Yukon | 50 | 18 | 68 | 2 |
| Newfoundland and Labrador | 7 | 50 | 57 | 3 |
| New Brunswick | 16 | 29 | 46 | 4 |
| Prince Edward Island | 9 | 34 | 44 | 5 |
| Nova Scotia | 14 | 26 | 40 | 6 |
| British Columbia | 14 | 17 | 31 | 7 |
| Ontario | 10 | 18 | 29 | 8 |
| Saskatchewan | 12 | 13 | 25 | 9 |
| Alberta | 10 | 13 | 23 | 10 |
Understanding the Correlation: What the Data Really Means
For the Skeptically Curious:
- Correlation doesn’t equal causation: Seeing UFOs doesn’t cause lottery purchases (or vice versa)
- Geographic isolation matters: Remote communities rank higher in both metrics
- Dark sky access: Less light pollution creates better UFO viewing conditions
- Entertainment options: Limited alternatives increase both sky-watching and lottery participation
- Community culture: Smaller populations foster higher reporting rates and social lottery play
For Responsible Gaming Advocates:
- Set strict monthly entertainment budgets before purchasing lottery tickets
- Never chase losses or view lottery play as a source of income generation
- Use licensed provincial lottery corporations only, and avoid unauthorized platforms
- Recognize warning signs: If lottery spending impacts essential expenses, seek help
- Access resources: Contact Problem Gambling Helpline at 1-866-531-2600 for confidential support
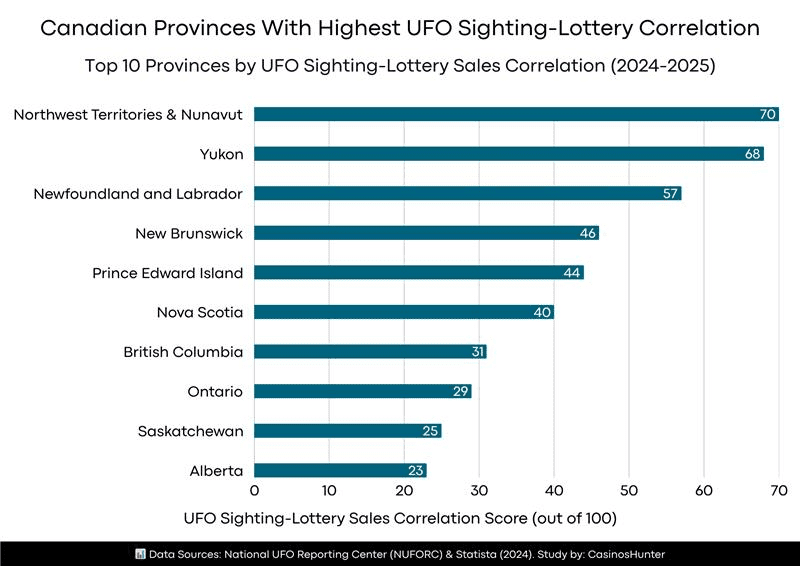
Top 10 Canadian Provinces and Territories Ranked by UFO Sighting-Lottery Correlation (2025)
- Northwest Territories & Nunavut – 70 correlation score
- Yukon – 68 correlation score
- Newfoundland and Labrador – 57 correlation score
- New Brunswick – 46 correlation score
- Prince Edward Island – 44 correlation score
- Nova Scotia – 40 correlation score
- British Columbia – 31 correlation score
- Ontario – 29 correlation score
- Saskatchewan – 25 correlation score
- Alberta – 23 correlation score
Methodology:
The study was conducted by CasinosHunter, an independent iGaming information platform helping Canadian players make informed, responsible, and enjoyable entertainment choices online.
The study analyzed UFO sighting data from the National UFO Reporting Center (NUFORC) database alongside 2024 lottery sales figures from Statista across all Canadian provinces and territories. Using 2025 population estimates, researchers calculated UFO sightings per 100,000 residents and lottery sales per capita to create normalized UFO Sighting Scores and Lottery Sales Scores. The Correlation Score (100) combines these metrics to identify provinces where both behaviors co-occur at elevated rates, revealing geographic and cultural patterns in how Canadians engage with unexplained phenomena and games of chance.
Data Sources:
- UFO Sighting Data → National UFO Reporting Center (NUFORC) | https://nuforc.org/subndx/?id=lAB
- Lottery Sales Data → Statista | https://www.statista.com/statistics/388346/sales-of-lotteries-by-province-canada/
- Dataset → https://docs.google.com/spreadsheets/d/1rp2BobPEI4zpvqxhdrAST5gymFFgZXgck1PK5lihvjM/edit?gid=236579344#gid=236579344
Be the first to comment